

Your blog is an extension of your website, your brand, and even your business. Is your blog reaching as many people as you were hoping it would? Are you trying to grow your audience by another hundred or thousand readers? Are you hoping to get more conversions (subscriptions or sales) from your blog traffic? With blogs, it can be difficult to gauge reader attention if they aren’t interacting with what you share, so how do you promote your blog in new and exciting ways? One word: infographics.
Traditional Images vs. New Infographics
As a blogger, you probably already know the massive power that blog header images have in promoting your blog, but are you using graphics to the fullest? It’s expected that social media posts with images attached (regardless of the content) will be engaged with ten times more than posts without images. To top that off, using colored images will increase a person’s desire to read something by 80%! But by that logic, just any old image will do, right? Wrong.
Now, more than ever, it’s time to engage your readers and grow your blog with Infographics. Using infographics will take your blog game to a whole new level. Why? The reasons are twofold:
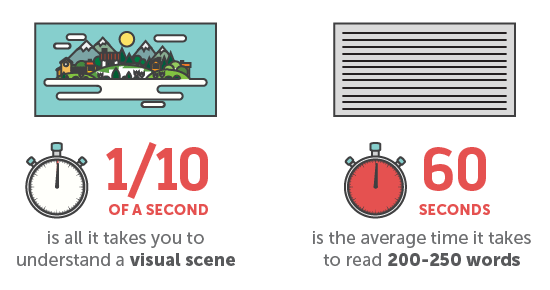
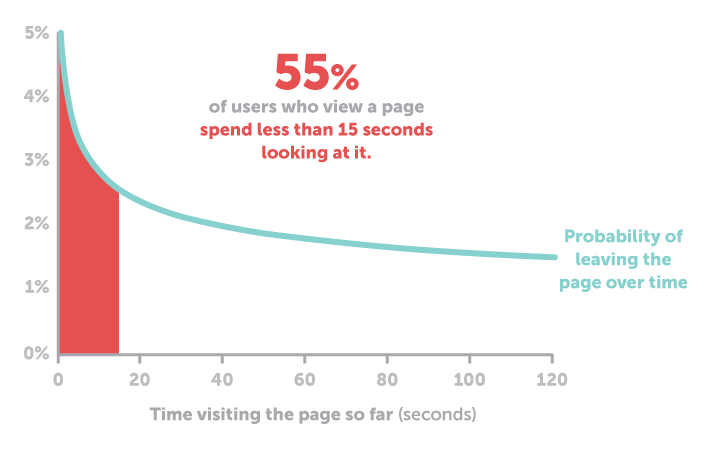
- People love easily digestible information (After all, people will skim 60% of a text-only article, but they will go all the way to the bottom if there is at least one visual).
- Infographics are indexing like crazy on Google (by 800+% since 2012), which means higher page ranking and easier ways for your audience to find your content organically.
Combining your blog content with a shareable, high quality infographic is going to, based on these two points, increase your community’s engagement with your blogs and grow your community. What’s not to like about that?
But what in the world do you put in an infographic, and how do you make them relevant to your blog and brand?
Curating Content for Your Infographic
Just like coming up with a unique blog post every day or week, creating infographics for your blog requires some thought beforehand. If you have an editorial calendar lined up, this is prime infographic inspiration. Take a good look at what topics you’re going to write about (or have written about), and break them down to create really great, shareable, engaging infographics. Here’s how:
- Take your blog ideas and try to sum them up in 5 to 10 clearly stated points.
- Once you have those points, try to find symbols or images that can replace the text but still make the point. (Did you know that our brains assign value and meaning to symbols in less than 250 milliseconds?)

- Design the infographic with colors, shapes, and even logos that are synonymous with your blog and brand.
- Scatter infographics throughout your blog posts (as we have done here), and make sure that you use at least one of them as your thumbnail for social media shares.
Of course, high quality infographics are going to appeal to the eye better than poorly-designed and formatted ones. Pay special attention to your infographics’ objects, text boxes, colors, and even grammar and spelling for the small amount of text they hold. Just because they’re visual doesn’t mean people won’t notice glaring errors!
A bad infographic can turn people off to your blog just as much as a great one can grow your audience.
What Now?
So you’ve created an infographic for one or two of your upcoming (or previously posted) blogs, and you’re wondering when your new readers are going to come rolling in. Unfortunately, infographics don’t just share themselves. To truly grow your blog with infographics, you’re going to have to get your blog out there. This can mean a few things, from:
Social media shares
You (hopefully) already promote your blog on social media, so now it’s pretty simple. Just make sure that your infographics are the thumbnail image people see when they scroll through their feed. Make sure they’re formatted properly (not pixelated or cut off) so that people get a good idea of what they’re clicking on. This is especially great for visual platforms that are considered “harder” to promote blogs on, like Instagram and Pinterest.
E-mail campaigns
Most bloggers use their email campaigns to notify their followers of a new blog post, or to recap a weekly set of blogs. If you do either of these (which is highly recommended, by the way), insert one or two infographics as images scattered throughout the email. The odds of getting that ever-elusive “click-through” from an email go way up when you use a high quality, relevant infographic. If you’re worried about going to spam or that your images won’t load in an email, this is a great article on how to do email images right.
Free content
Readers love free stuff! Give away great, free infographic content with your blog subscriptions, whether in PDF format or in the form of RSS feed blog updates. Making your blog visual and providing great, free content (complete with infographics) is going to increase your subscribe rate. You can also promote your new (free) content in your blogs, like e-books, courses, etc. Make sure these are highly visual and contain infographics, as well!
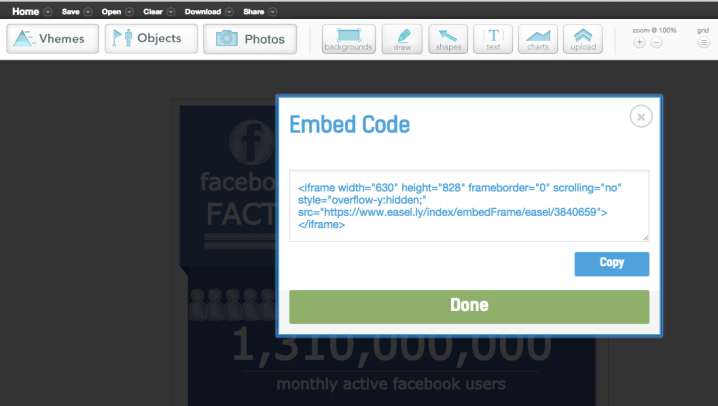
Embed codes and backlinks
The Embed Code is the Holy Grail of blog and website traffic for infographic users. Always give your infographic an embed code, which can be found in your infographic creator tool and inserted into the HTML area of your website. This makes sure that, when your infographic gets shared, the traffic leads back to your blog page.
Also make sure to use links to your infographic and blog when you interact with others’ content, too. The backlink process works exceptionally well if you have a relationship with an influencer who has higher blog traffic than you! Reach out to them and ask them to share your infographic (with link) on their social media, website, or blog. It’s much easier for them to share an image connected to your blog than to share 1,500 words of text!
If you don’t have a well-established content marketing process, that list may seem slightly overwhelming. Free content? Embed codes? You may be worried that infographics will take a little more work than you want to put in, but that’s the beauty of it: they require a little effort up front and then they return to you with more readers, more conversions, and a bigger blog!
Start using infographics to expand your blog’s reach today, and see the results almost immediately. Let us know how you’re doing with your infographics, and how they’re helping you grow your blog!
About the author
Latasha Doyle, discusses all things “infographic” on Easel.ly’s blog. If you are looking for more information on creating infographics, you can also check out Easel.ly’s free ebook, “Infographic Crash Course.”